Select language
Trends
Global Climate Reports
| Title | [REN21] RENEWABLES 2024 GLOBAL STATUS REPORT RENEWABLE ENERGY IN ENERGY DEMAND |
|---|---|
| Category | |
GLOBAL TRENDS
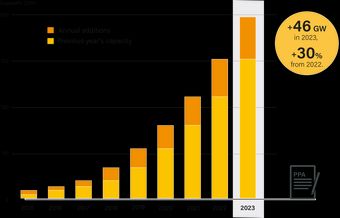
Despite a notable decline in the prices of fossil fuels and other energy commodities in the first half of 2023, wholesale electricity prices remained high in many countries, negatively affecting energy-consuming sectors. 1 Inflation and high interest rates continued to hamper investment, particularly in emerging markets that face debt burdens and a higher cost of capital. 2 Meanwhile, massive subsidies to fossil fuels remain prevalent and have distorted the market, placing renewables at a disadvantage. 3 Renewables nonetheless continued to prove attractive as an affordable and secure energy source in 2023, with investments rising to a record USD 623 billion and corporate power purchase agreements reaching a record 46 gigawatts (GW). 4 (See Sidebar 1.)
Sidebar 1. Corporate Power Purchase AgreementsVarious financial mechanisms exist for private companies to support, invest in, and purchase renewable energy, such as power purchase agreements (PPAs), debt/equity financing, green bonds, renewable energy certificates (RECs), leasing and participation in joint ventures/partnerships. Corporate renewable energy procurement through PPAs is rising globally. In a corporate PPA, the company agrees to purchase renewable energy directly from a project developer, with terms negotiated between the buyer and seller. In 2023, companies' PPA commitments represented 9.7% of total worldwide capacity additions, with a record 46 GW of solar and wind contracts signed, a 30% increase from 2022. PPA additions grew 12% in 2023, down from the 33% average growth between 2015 and 2023. (See Figure 1.) Europe was the fastest growing region for corporate renewable energy PPAs in 2023, experiencing 74% growth for a total volume of 15.4 GW. Eight market segments in Europe have yearly contracted corporate renewable PPAs exceeding 500 megawatts (MW). The retail sector signed 72% more PPAs than in 2022, followed by food and drinks (up 61.9%), transport (up 57.2%) and automotive (up 45.5%). Solar photovoltaics (PV) dominated with 65% of the PPA volume in Europe in 2023, though contracts were also signed for onshore wind power (2.3 GW) and offshore wind power (2 GW). The largest market for corporate renewable energy PPAs was the United States, with 37% (17.3 GW) of the total announced volume for 2023, down 16% from the country's record 20.6 GW in 2022. The heavy industry and information technology sectors were the biggest buyers globally. Amazon remained the largest corporate PPA buyer for the fourth consecutive year, followed by Meta, LyondellBasell and Google. BloombergNEF estimates that companies with targets for 100% renewable energy as part of the RE100 initiative will require an additional 105 GW of solar and wind power by 2030. From the sellers' side, Engie sold the most PPAs in 2023 with 2.4 GW of deals, surpassing AES (1.9 GW), followed by Tata Power (1.2 GW), Lightsource BP (1 GW) and Eneco (0.9 GW). Source: See endnote 4 for this module. FIGURE 1.Corporate Renewable Energy Power Purchase Agreements, Global Capacity and Annual Additions, 2015-2023
The post-crisis recovery packages of 2022 sparked a surge in renewable energy deployment; however, progress has since stalled, and more ambitious structural and integrated reforms are needed to maintain the momentum. 5 In 2023, there were indications that policy measures supporting the uptake of renewables may be revoked or weakened in the face of multi-faceted economic and political pressures. 6
Disparities in renewable deployment across the sectors highlights the need for integrated policies
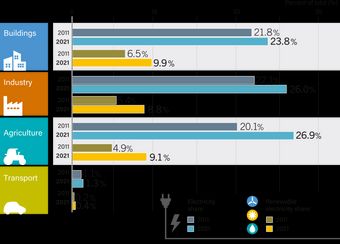
By demand sector, the share of renewables in total final energy consumption (TFEC) ranged from as high as 16.8% in industry to as low as 3.9% in transport in 2021 (latest data available). 7 (See Figure 2.) These disparities reflect not only the differing characteristics of sectors, but also a lack of integrated policies aimed at increasing the renewable energy share both within and across sectors. Further action is needed to speed the electrification of end-use sectors (See Sidebar 2.) and to transition to renewable heat and fuels. 8 FIGURE 2.Renewable Share of Total Final Energy Consumption, by Sector, 2021
Note: Total final energy consumption in the above figure does not account to military activty and energy use not elsewhere specified. Source: See endnote 7 for this module. Sidebar 2. Electrification of End-Use SectorsElectrification of demand sectors allows major energy consumers to tap into the rising share of renewables in the power supply. Agriculture maintained the highest electrification rate among all sectors in 2021 (latest data available), reaching 27%, up from 20.1% in 2011. (See Figure 3.) This was enabled by cost savings, technological advancements and improved performance of electric machinery. In transport, electric vehicles accounted for 18% of all car sales in 2023, with 35% year-on-year growth. At least 18 countries announced new policies during the year supporting the uptake of electric vehicles. In buildings, heat pump installations increased 10% in 2023, mostly in Europe. However, electrification of buildings increased only 2 percentage points, and of transport just 0.2 percentage points, between 2011 and 2021. (See Figure 3.) Industry electrification has been limited due to the challenges of high-temperature processes such as steelmaking or cement production, with wide variation among industrial sub-sectors. Electrification has stalled in most regions except China, where it grew 10 percentage points between 2011 and 2021. (See Figure 4.) The shares of electricity in total final energy consumption in the United States and the European Union (EU) remained stagnant In 2021, at around 23.7% and 23.4%, respectively. China saw the largest growth in electrification rates between 2011 and 2021 in buildings (up 12 percentage points), transport (up 1.1 percentage points) and industry (up 10.2 percentage points). The United States led in buildings electrification during this period, with a 12.2 percentage points increase. Source: See endnote 8 for this module. FIGURE 3.Electricity and Renewable Shares of Total Final Energy Consumption, by Sector, 2021
FIGURE 4.Share of Electricity in Total Final Energy Consumption by Major Country/Region, 2011-2021
POLICY TRENDSAs of 2023, only 13 countries had in place renewable energy policies for all four demand sectors (power, buildings, industry and transport). 9 A further 20 countries had policies for three demand sectors, and 84 countries had no demand-sector policies in place. 10 (See Figure 5.) Of the 69 countries that set renewable energy targets for end-use sectors between 2010 and 2020, only 17 had renewed or set new targets beyond 2024. 11 Countries announced around 21 new renewable energy regulatory policies in demand sectors in 2023, bringing the total number to 111. 12 Transport has seen regulatory action in 64 countries, followed by buildings (30), industry (12) and agriculture (5). 13 (See Figure 6.) Various fiscal and financial incentives – including grants, rebates, and tax reductions or exemptions – have been implemented to boost the adoption of renewables across different sectors. 14 In 2023, progress on renewable energy use in buildings continued to be driven by net metering, incentives for rooftop solar, and targets for energy use and retrofitting. 15 Building energy codes have become increasingly widespread globally. As of 2023, the number of building codes worldwide totalled 81 for residential structures and 77 for non-residential structures, with 80% of the codes being mandatory. 16 In industry, nine countries introduced or updated fiscal and financial policies supporting the uptake of renewables during 2023, and three countries introduced regulatory incentives or mandates. 17 Countries also continued to craft broader national renewable energy strategies relevant to industry, such as the United Kingdom's plan for net zero emissions and the EU's Carbon Border Adjustment Mechanism. 18 Most new policies in industry target renewable hydrogen, particularly in heavy industry. 19 At least 49 countries had specific renewable energy targets for transport as of 2023. 20 Ten countries introduced or revised biofuel blending mandates (with some reducing their mandates). 21 At least 18 countries announced new electric vehicle policies, with a range of financial incentives such as subsidies, grants and tax benefits aiming to encourage adoption of the vehicles and related infrastructure. 22 Renewable hydrogen policies and green shipping corridors continued to emerge, whereas efforts to integrate renewables into aviation, rail, and shipping advanced only slowly, with a few new mandates for sustainable aviation fuel, sustainable marine fuels and hydrogen-powered rail development. 23 Policies related to energy use in agriculture often lack coherence and can send mixed signals: for example, subsidies or tax reductions for agricultural diesel have led to reluctance among farmers to consider renewable energy investments. 24 A major advancement in 2023 was the EU's Common Agricultural Policy, which targets 1.5 GW of renewable energy capacity on farms by 2027, with a focus on biogas and solar power. 25 FIGURE 5.Countries with Renewable Energy Policies for End-Use Sectors, as of 2023
Source: See endnote 10 for this module.
FIGURE 6.Number of Countries with Renewable Energy Regulatory Policies, by Demand Sector, 2013-2023
Source: See endnote 134 for this module. MARKET DEVELOPMENTS AND INVESTMENT TRENDSIn buildings and industry, concerns about volatile energy prices and supply disruptions have highlighted the role of renewables as reliable and affordable alternatives to fossil fuels. In 2023, significant investments were made in solar thermal technologies for buildings and industry, while heat pumps continued to attract funding (despite a 4% decline in investment, to USD 63.1 billion). 26 Bioenergy has remained the leading source of renewable heat in buildings, although renewable electricity is the fastest growing heat solution. 27 Rooftop solar PV systems continued to see strong growth in 2023, while heat pump installations increased 10% (with a 38% increase in Europe alone). 28 Industry relies heavily on heat, which accounts for around three-quarters of the sector's energy use. 29 Renewable energy projects for heavy industry have focused on electric arc furnaces, hydrogen and bioenergy. 30 Light industries are deploying industrial-scale heat pumps and solar thermal systems. 31 Bioenergy use in industry is on the rise, increasing 46% between 2011 and 2021. 32
Progress in the transport sector was driven mainly by electric vehicles and related charging infrastructure, which have become key recipients of energy transition financing, with investment reaching USD 634 billion in 2023. 33 Biofuels continued to be the dominant renewable fuel in transport, supplying 90% of the sector's renewable energy use in 2021 (biofuel consumption increased 3% in 2021 but remained slightly below pre-pandemic levels). 34 The share of renewable energy adoption in agriculture increased from 10.2% in 2010 to 15.4% in 2021, driven by cost reductions and food preservation benefits. 35 Solar PV led the way, with agrivoltaics gaining traction in Europe and India. 36 PV-powered mini-grids and water pumps boosted rural electrification and irrigation in countries across the globe. 37 Geothermal energy and micro-hydropower also saw increased use, particularly in the United States. 38
|
|
| File | |
| Sources | REN21 |
| View Original URL | |
| Prev | [IEA] Enhancing China’s ETS for Carbon Neutrality: Introducing Auctioning |
|---|---|
| Next | [IEA] Strategies for Affordable and Fair Clean Energy Transitions |


 In 2023, investment in EVs and charging infrastructure surpassed investment in renewables.
